Grafana logo

Grafana Review

Visit

Open source observability for metrics, logs, traces, and dashboards

Grafana is an observability and data visualization platform for engineers who need to monitor infrastructure, applications, and services.

AI Panel Score

8.5/10

6 AI reviews

Reviewed

AI Editor Approved

About Grafana

In practice, users connect Grafana to one or more data sources, then construct dashboards using a panel editor that supports a wide range of visualization types—time series charts, heatmaps, tables, stat panels, and more. Queries can be written in the native query language of each data source (PromQL, LogQL, TraceQL, SQL, etc.) and transformed within the panel before rendering. Dashboards can be shared across teams, templated with variables, and organized into folders with access controls.

Grafana's distinguishing capability is its composable observability stack. Beyond dashboards, the platform ships with Grafana Alerting for rule-based notifications, Grafana IRM for on-call scheduling and incident coordination, SLO management, synthetic monitoring, and k6-based load testing. On the data side, Grafana maintains purpose-built open source backends: Loki for logs, Mimir for metrics (Prometheus-compatible), Tempo for distributed traces, and Pyroscope for continuous profiling. Grafana Alloy is the OpenTelemetry collector distribution used to ship telemetry into these backends. Grafana Beyla provides eBPF-based auto-instrumentation without code changes.

Grafana targets software engineers, DevOps and platform teams, and SREs responsible for operating applications and infrastructure. Grafana OSS is free and self-hosted under the AGPL license. Grafana Cloud offers a free tier and paid plans starting at usage-based pricing, with enterprise tiers available under a commercial license. Competitors in the observability and dashboarding space include Datadog, New Relic, Dynatrace, and open source alternatives such as Prometheus with its own UI.

Grafana Cloud runs as a managed SaaS platform accessible via web browser. The self-hosted OSS version runs on Linux, macOS, Windows, and in containers/Kubernetes. The platform exposes HTTP APIs for automation, supports provisioning via configuration files, and integrates with hundreds of data sources through official and community-built plugins.

Features

AI

  • Dynamic Alerting

    Machine-learning-driven alerting that dynamically adjusts alert thresholds based on observed data patterns rather than static rules.

  • Grafana Assistant & Sift

    An AI assistant and automated incident investigation tool (Sift) that analyzes error patterns and assists with root-cause investigation during incidents.

Analytics

  • Knowledge Graph

    Maps and displays relationships between services and resources in Grafana Cloud to provide topology context during investigation and monitoring.

  • Service Level Objectives (SLO)

    Allows users to define, track, and manage service level objectives within Grafana Cloud's alerting and IRM workflows.

Automation

  • Alerting

    Users can define alert rules, configure notification routing, and manage alerts across their observability data in both Grafana OSS and Grafana Cloud.

  • Incident Response and Management (IRM)

    Provides on-call schedules, escalation policies, and incident coordination workflows to manage and respond to production incidents.

Core

  • Dashboards & Visualizations

    Users can create and use interactive dashboards with multiple visualization types to display metrics, logs, traces, and profiles from connected data sources.

  • Synthetic Monitoring & Performance Testing

    Enables synthetic uptime checks and k6-based load and performance testing to proactively validate service availability and performance.

  • Unified Observability (Metrics, Logs, Traces, Profiles)

    Grafana consolidates metrics (Mimir/Prometheus), logs (Loki), distributed traces (Tempo), and continuous profiles (Pyroscope) into a single platform for full-stack observability.

Integration

  • Grafana Integrations & Fleet Management

    Offers prebuilt integrations for infrastructure and services, plus fleet management tooling to configure and manage collectors and telemetry pipelines at scale.

  • Kubernetes & Cloud Provider Monitoring

    Prebuilt monitoring workflows for Kubernetes clusters and cloud providers (AWS, Azure, GCP) using integrations and dashboards in Grafana Cloud.

  • eBPF Auto-Instrumentation (Beyla)

    Grafana Beyla uses eBPF to automatically instrument applications and ship telemetry without requiring code changes.

Preview

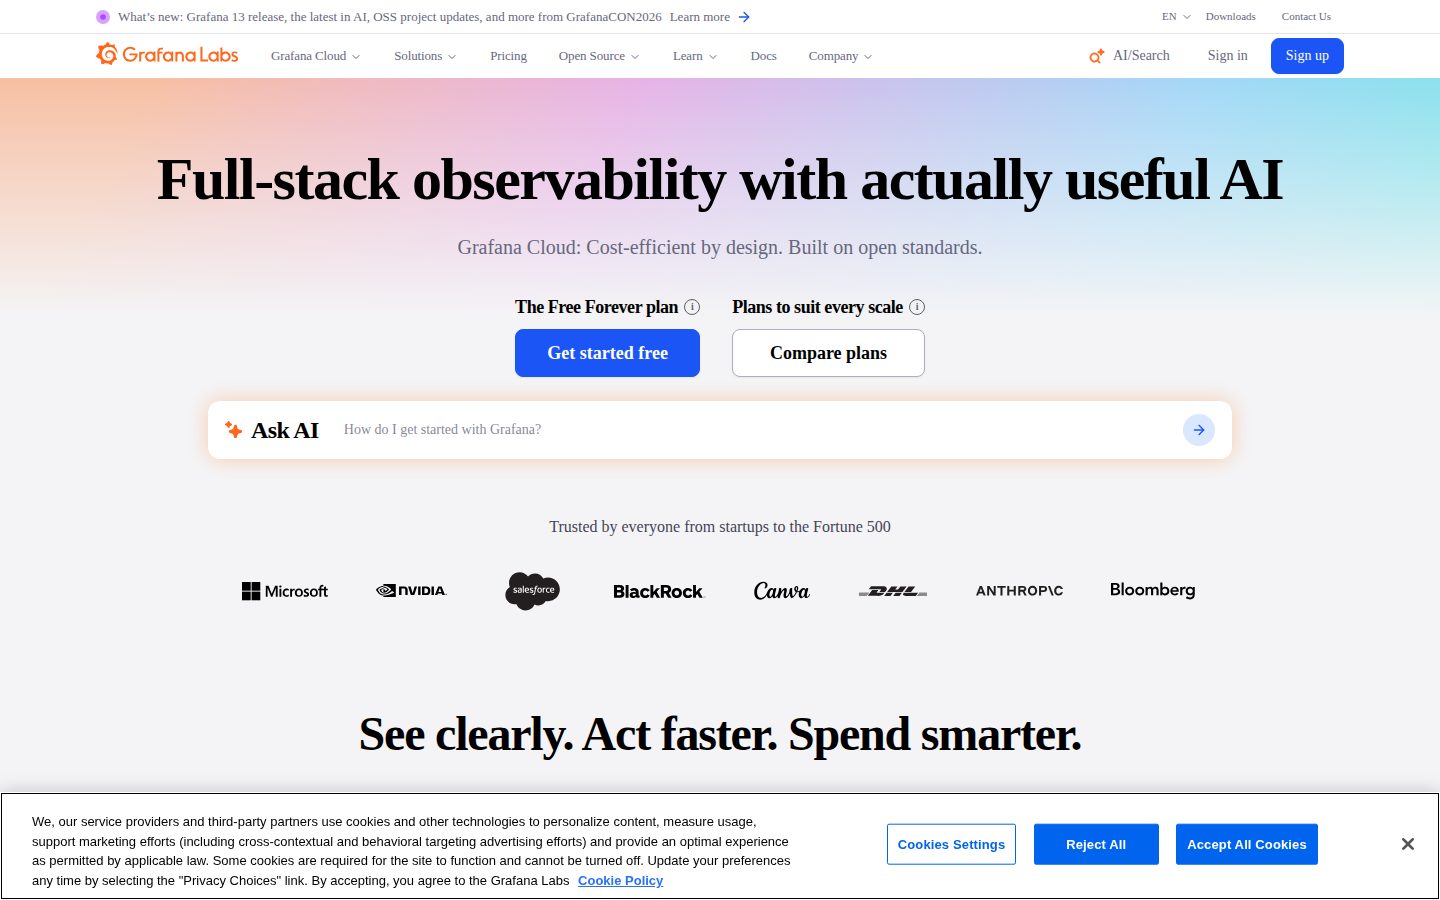
Grafana desktop previewGrafana mobile preview

Pricing Plans

Free

Free

Perfect for personal projects, exploring new ideas, and early-stage startups. No charges ever.

  • All Grafana Cloud services with limited usage
  • 10k active metrics series per month
  • 50 GB ingested per month for logs, traces, profiles
  • 14 days retention for metrics, logs, traces, profiles & k6
  • Community support
Popular

Pro

$19/monthly

Ready for scaling with more retention, basic support, and usage-based pricing. $19/month platform fee plus usage above free tier limits.

  • Everything in Free plus pay-as-you-go above free tier
  • Metrics: $6.50/1k series after 10k included
  • Logs/Traces/Profiles: $0.05/GB Process, $0.40/GB Write, $0.10/GB Retain after 50 GB included
  • 13 months retention for metrics; 30 days for logs, traces, profiles
  • 8x5 email support

Enterprise

Contact sales

Full-service offering for companies with security, compliance, and deployment requirements. Starts at $25,000/year spend commitment.

  • Minimum $25,000/year commit with volume discounts (metrics as low as $3/1k series)
  • Custom retention options
  • Premium support and Observability Architect
  • Deployment flexibility: Public Cloud, Federal Cloud, or Bring Your Own Cloud
  • Security and compliance features

AI Panel Reviews

The Decision Maker

The Decision Maker

Strategic bet, vendor viability, timing, adoption approval
8.8/10

Grafana is the default observability stack — open source, battle-tested, hard to displace.

Dominant in the category with a free OSS tier, a $19/month cloud entry point, and FedRAMP-certified enterprise tier. The only real tradeoff is setup complexity versus Datadog's plug-and-play.

Grafana isn't a startup bet. It's the observability standard that Datadog, New Relic, and Dynatrace compete against. The composable stack — Loki, Mimir, Tempo, Pyroscope — means you can go deep without vendor lock-in, and the free tier with 10k active metric series gives real evaluation room before any spend. That's a defensible position at every level of the org.

Two things I'd flag. One: the Pro plan's usage-based pricing ($6.50/1k metric series above the free tier) can compound fast on large fleets — model it before you commit. Two: Beyla's eBPF auto-instrumentation and Sift's AI incident analysis are genuinely differentiated versus Datadog's equivalent features, not just catch-up.

The $25k/year enterprise floor is real, but for teams already running Prometheus and Kubernetes, this is the natural graduation path. Skip this only if your team can't staff the operational overhead of self-hosted.

Competitive Positioning8.8

Beyla's eBPF auto-instrumentation and Adaptive Telemetry's claimed 80% cost reduction are real differentiators Datadog can't match on open-source terms.

Reputation Risk9.0

Grafana is the board-safe choice — peers, SREs, and investors recognize it immediately as the industry standard.

Speed to Value7.8

Grafana Play requires zero registration, but dashboard depth and PromQL/LogQL queries mean meaningful ramp time before full value lands.

Strategic Fit8.5

Unified metrics, logs, traces, and profiles under one roof advances platform maturity, not just cost reduction.

Vendor Viability9.2

Grafana Labs is a decade-in, category-defining company with FedRAMP and SOC Type II certs — not a funding story to monitor.

Pros

  • Free OSS tier plus Grafana Play — genuine zero-friction evaluation
  • Full composable stack: Loki, Mimir, Tempo, Pyroscope all maintained by the same team
  • FedRAMP, SOC Type II, PCI DSS certified — enterprise procurement won't stall
  • eBPF auto-instrumentation via Beyla means no code changes required

Cons

  • Usage-based Pro pricing compounds fast on large metric volumes — model it before scaling
  • Enterprise requires $25k/year minimum commit, no trial path at that tier
  • Self-hosted OSS demands real operational staffing — it's not Datadog's plug-and-play

Right for

Engineering teams already running Prometheus or Kubernetes who want unified observability without Datadog's lock-in pricing.

Avoid if

Your team has no ops bandwidth for self-hosted tooling and needs same-day instrumentation out of the box.

The Domain Strategist

The Domain Strategist

Craft and strategy in the product's domain — adapts identity per category, same lens
8.8/10

Grafana is the default observability bet for any engineering org that wants stack ownership.

The composable stack — Mimir, Loki, Tempo, Pyroscope — is a genuine architectural moat. If you adopt Grafana Cloud today, in 3 years you have a unified telemetry platform that you control, not one that controls your pricing.

Grafana's architecture tells you everything. Mimir for metrics, Loki for logs, Tempo for traces, Pyroscope for profiles — four purpose-built backends, each open-sourced, each Prometheus-compatible or OpenTelemetry-native. That's not a vendor building features; that's a team that understands data plane design. Beyla's eBPF auto-instrumentation and Alloy as an OTel collector distribution show they're building for orgs that can't touch every service codebase. The $19/month Pro floor plus usage-based pricing above 10k active series means you scale cost linearly, not via surprise contract renegotiation like Datadog.

The tradeoff is real: PromQL, LogQL, TraceQL, SQL — you're managing four query languages across one UI. Datadog abstracts this. Grafana doesn't, and that's a deliberate philosophy, not an oversight. SREs who live in the terminal will love it; teams without observability maturity will struggle at the query layer.

Sift and Grafana Assistant are the AI layer — automated incident investigation and dynamic alerting thresholds. These are still maturing relative to Dynatrace's Davis engine, but the knowledge graph providing topology context is the right architectural foundation. FedRAMP and SOC Type II certifications mean regulated industries aren't blocked. This is the stack I'd bet on for a 3-year horizon.

Category Positioning8.5

Grafana sits at the center of the open-source observability ecosystem in a way Datadog and New Relic structurally cannot; the Adaptive Telemetry suite's claimed 80% cost reduction sharpens the commercial case.

Domain Fit9.0

PromQL/LogQL/TraceQL query parity, k6 load testing, and IRM on-call scheduling maps directly to how SRE and platform teams actually operate.

Integration Surface9.0

Hundreds of plugins, Grafana Alloy as OTel collector, and Kubernetes/AWS/Azure/GCP prebuilt integrations cover the vast majority of modern engineering stacks without rip-and-replace.

Long-term Implications8.8

AGPL OSS core plus OpenTelemetry-native backends means you're not locked into Grafana's pricing; you're locked into your own data plane, which is the right trade.

Strategic Depth9.2

Four open-source backends plus eBPF instrumentation signals genuine platform engineering depth, not dashboard-layer thinking.

Pros

  • Full telemetry stack — metrics, logs, traces, profiles — in one platform with open-source backends
  • Usage-based pricing at $6.50/1k metric series after 10k is structurally cheaper than Datadog at scale
  • Beyla eBPF auto-instrumentation removes the code-change barrier for legacy services
  • FedRAMP and SOC Type II certifications unlock regulated-industry deployment

Cons

  • Four query languages (PromQL, LogQL, TraceQL, SQL) demand observability maturity that junior teams often lack
  • AI features like Sift and dynamic alerting are still maturing versus Dynatrace's Davis engine
  • $25,000/year minimum Enterprise commit is a real threshold for mid-market engineering orgs

Right for

Platform and SRE teams who want full-stack observability without ceding data plane ownership to a closed vendor.

Avoid if

Your team lacks the query-language fluency to operate multi-backend observability without heavy abstraction.

The Finance Lead

The Finance Lead

Money, total cost of ownership, contracts, procurement math
8.1/10

$19/month platform fee plus usage-based overages — math gets complicated fast at scale.

Grafana Cloud's pricing page is unusually honest: three tiers, all visible, no sales call required. Usage-based billing above the free tier means year-3 costs depend entirely on telemetry volume discipline.

Free tier is real: 10k active metric series, 50 GB ingested, 14-day retention. Pro starts at $19/month platform fee — but that's the floor, not the ceiling. Metrics overage at $6.50/1k series. Logs write at $0.40/GB. A 50-engineer team shipping serious telemetry lands $2K-$8K/year easily, maybe more. No published cap on overage exposure. That's the real risk.

Enterprise commits at $25K/year minimum. Volume discounts push metrics to $3/1k series — less than half the Pro rate. Compare to Datadog, where a similar stack routinely runs $60K-$120K/year at 50 engineers. Grafana's OSS exit valve also limits lock-in risk. Adaptive Telemetry claims 80% cost reduction — plausible with careless instrumentation, but verify against your actual ingest before budgeting it.

Contract terms aren't fully public beyond the commit structure. Auto-renewal windows and termination clauses require a sales conversation at Enterprise tier. Pro is month-to-month by inference — usage-based billing suggests no hard term. Procurement teams will appreciate the self-serve path; legal teams will want the Enterprise MSA reviewed carefully.

Billing & Procurement7.8

Self-serve Pro billing is low-friction; Enterprise procurement requires a sales engagement but FedRAMP and SOC II certifications reduce compliance overhead.

Contract Flexibility7.0

Pro appears month-to-month; Enterprise requires $25K/year commitment with undisclosed auto-renewal and cancellation terms.

Pricing Transparency8.5

Three tiers fully published with per-unit overage rates visible on the pricing page — rare for an observability platform.

ROI Clarity8.0

SLO management and IRM features tie directly to uptime value; the 80% cost-reduction claim from Adaptive Telemetry is specific but unverified without customer data.

Total Cost of Ownership7.2

Usage-based overages for logs ($0.40/GB write) and metrics ($6.50/1k series) create unpredictable year-3 costs without telemetry governance in place.

Pros

  • Pricing page shows all three tiers and per-unit overage rates — no discovery call required
  • Free tier is genuinely functional: 10k metric series, 50 GB ingest, 14-day retention
  • $25K Enterprise commit is low vs Datadog at comparable scale
  • OSS option (AGPL) eliminates vendor lock-in as a fallback

Cons

  • No published overage cap — ingest spikes can produce unpredictable invoices
  • Enterprise auto-renewal and termination terms aren't publicly documented
  • Usage-based model requires internal telemetry governance to control costs
  • $0.40/GB log write rate compounds quickly at high-volume services

Right for

Platform or SRE teams that want transparent usage-based pricing with an OSS fallback and existing Prometheus or Loki investments.

Avoid if

Teams without telemetry volume discipline — uncapped overage exposure will make year-3 budgeting unreliable.

The Domain Practitioner

The Domain Practitioner

Daily hands-on reality in the product's domain — adapts identity per category, same lens
8.8/10

The SRE stack that actually ships with a backend, not just a pretty dashboard.

Grafana is the composable observability platform SREs actually run in production — OSS roots, real backends, and a Cloud tier that doesn't force a rip-and-replace. The AI layer is genuinely integrated, not cosmetic.

Mimir for metrics, Loki for logs, Tempo for traces, Pyroscope for profiles — four purpose-built backends, all OpenTelemetry-compatible, all composable. Grafana Alloy as the collector distribution means your telemetry pipeline isn't a black box. Beyla's eBPF auto-instrumentation ships telemetry without touching application code. That's a serious stack. Datadog gives you this too, but you're renting every piece of it.

Day-three reality: PromQL, LogQL, and TraceQL are each their own learning curve. Panel editor query transforms work, but debugging a misfiring alert rule that crosses data sources will eat an afternoon. The 14-day retention on the Free tier is a real constraint for incident retrospectives — you'll hit it. Pro starts at $19/month but usage-based metrics pricing at $6.50/1k series scales fast at production cardinality.

Sift for automated incident investigation and Dynamic Alerting with ML-adjusted thresholds are the AI features worth watching — the docs indicate both are Cloud-only. SLO management and IRM on-call scheduling live alongside the dashboards, not bolted into a separate product. That integration is the actual moat.

Day-3 Reality8.2

Multi-query-language environment is powerful but demands daily fluency; OSS self-hosting adds operational overhead Datadog users never see.

Documentation Practitioner-Fit8.5

Docs cover PromQL, LogQL, TraceQL, and provisioning via config files at the depth an SRE actually needs — changelog is active and specific.

Friction Surface7.5

Cross-data-source alert debugging and cardinality management are recurring friction points at production scale.

Power-User Depth9.2

Templated dashboards, HTTP API automation, fleet management, Adaptive Telemetry, and Beyla eBPF instrumentation give power users a real ceiling to grow into.

Workflow Integration9.0

Hundreds of plugins, Kubernetes and cloud provider prebuilts, and no rip-and-replace requirement make this fit existing SRE toolchains cleanly.

Pros

  • Full observability stack — Mimir, Loki, Tempo, Pyroscope — owned and composable
  • Beyla eBPF auto-instrumentation requires zero code changes
  • Sift + Dynamic Alerting are genuinely integrated AI features, not demo-ware
  • FedRAMP and SOC Type II compliance for teams that need it

Cons

  • Three separate query languages (PromQL, LogQL, TraceQL) mean real onboarding overhead for rotating on-call
  • 14-day Free tier retention is too short for post-incident review
  • Usage-based metrics pricing at $6.50/1k series above 10k gets expensive fast at production cardinality
  • AI-powered Sift and Dynamic Alerting are Cloud-only — OSS users don't get them

Right for

Platform and SRE teams who want a composable, open-standards observability stack without full vendor lock-in.

Avoid if

Your team wants a single query language and fully managed telemetry with no cardinality management overhead.

The Power User

The Power User

Daily human experience, onboarding, polish, learning curve, reliability
8.4/10

The dashboard that actually knows your whole stack — if you're willing to learn it

Grafana is the real deal for DevOps and SRE teams who need metrics, logs, traces, and profiles in one place without vendor lock-in. The free tier is genuinely useful; the depth is genuinely demanding.

Ten thousand active metric series on the free plan, Loki for logs, Tempo for traces, Pyroscope for profiles — all connected. That's not a teaser, that's a working observability stack at $0. The Pro tier starts at $19/month and scales on usage, which beats Datadog's invoice anxiety by a wide margin. Grafana Play lets you poke around with no account, which is a confident move. Most tools hide until you hand over an email.

The learning curve is real, though. PromQL, LogQL, TraceQL — you're picking up query languages, not clicking dropdowns. Day three without a background in Prometheus and you're Googling syntax. The Grafana Assistant and Sift features are trying to soften that, but they're cloud-only. The AI-assisted root-cause investigation is genuinely useful territory once you're past the setup hill.

Mobile is read-only at best, which for a platform marketing itself as incident-response-capable stings a little. On-call doesn't wait for a laptop. That's the honest gap between what the IRM features promise and what you can do from your phone at 2am.

Daily Polish7.5

Dashboard editor and panel types are mature and well-considered, but the experience varies noticeably between OSS and Cloud — two teams, two polish levels.

Learning Curve6.5

Multiple query languages, composable backends, and fleet management tooling mean month three looks very different from hour one — powerful but steep.

Mobile Parity5.5

A platform with IRM and on-call scheduling that doesn't offer real mobile functionality is a meaningful gap for the people who actually get paged.

Onboarding Experience7.0

Grafana Play deserves credit for zero-friction exploration, but connecting real data sources and writing first queries is homework, not a welcome mat.

Reliability Feel8.5

The changelog shows years of steady iteration and the OSS community is enormous — this isn't a fragile product; it's infrastructure-grade.

Pros

  • Free tier includes 10k metric series and 50GB logs/traces — actually usable, not just decorative
  • No rip-and-replace: connects to Prometheus, existing data sources, hundreds of plugins
  • Beyla eBPF auto-instrumentation means telemetry without touching application code
  • Adaptive Telemetry claims up to 80% cost reduction — real differentiator vs. Datadog at scale

Cons

  • PromQL, LogQL, TraceQL — the query language overhead is real and hits beginners hard
  • AI features like Sift and the Assistant are Grafana Cloud-only, not available in OSS
  • Mobile experience doesn't match the on-call incident response promise
  • Enterprise commitment starts at $25,000/year — nothing in between Pro and that cliff

Right for

DevOps and SRE teams who want a composable, open-standards observability stack without Datadog-scale invoices.

Avoid if

You need a polished, mobile-capable incident response tool and don't have engineers willing to own the query layer.

The Skeptic

The Skeptic

Contrarian. Watch-outs, deal-breakers, broken promises, category patterns
8.2/10

Eleven-year-old category anchor. OSS roots make the exit story unusually clean.

Grafana isn't pitching a new category — it owns one. The open-source core, composable stack, and no-lock-in angle are credible because the AGPL license and self-hosted path actually exist.

Three tells worth noting. One: 'agentic era' in the meta description — the kind of superlative that ages poorly. Two: the AI features (Sift, Dynamic Alerting) are real named capabilities, not vaporware bullets. Three: $25,000/year enterprise floor is a real number, not 'contact us' theater.

The exit portability here is genuinely strong. PromQL, LogQL, OpenTelemetry — all open standards. If Grafana Cloud goes sideways, you run OSS on your own infra. Datadog can't say that. New Relic can't say that. That's a durable differentiator, not a marketing claim.

Tradeoff: the composable stack (Loki, Mimir, Tempo, Pyroscope, Alloy, Beyla) is powerful but operationally heavy if self-hosted. The free tier's 14-day retention limit will push real users to Pro fast. Complexity ceiling is real. But the moat is real too.

Competitive Differentiation8.5

Datadog and Dynatrace are closed-stack; Grafana's composable open-source backends plus no-rip-and-replace plugin model is a structurally different bet, not a feature-list difference.

Exit Portability9.2

AGPL OSS core, open query languages (PromQL, LogQL, TraceQL), and OpenTelemetry-native Alloy collector mean migration off Cloud to self-hosted is a realistic path, not a hypothetical.

Long-term Viability8.8

FedRAMP certification, $25k enterprise minimums, named Observability Architect support tier, and a changelog that ships named products (Beyla, Alloy) all point to a well-funded, durable operation.

Marketing Honesty7.8

'Agentic era' headline is fashionable overreach, but named features like Sift and Beyla eBPF instrumentation are specific and verifiable — grounded underneath the buzzword layer.

Track Record Match9.0

Grafana has been the default OSS dashboard layer for Prometheus-based stacks for years; changelog activity and the Loki/Mimir/Tempo ecosystem show sustained shipping, not coasting.

Pros

  • Exit path is real — OSS core under AGPL, open standards throughout
  • Free tier exists with no trial expiry; 10k active metrics series included
  • Composable stack covers metrics, logs, traces, profiles in one platform
  • FedRAMP and SOC Type II certifications reduce compliance friction for enterprise buyers

Cons

  • Self-hosted stack (six-plus components) has serious operational overhead
  • Free tier's 14-day retention will push most real workloads to paid quickly
  • 'Agentic era' / AI framing on the homepage is ahead of what the AI features currently justify
  • $25,000/year enterprise floor is a hard step up from $19/month Pro

Right for

Platform and SRE teams who want full-stack observability without vendor lock-in and already run Prometheus-based infrastructure.

Avoid if

You need a fully managed, zero-config observability solution and don't have engineering bandwidth to operate a composable stack.

Buyer Questions

Common questions answered by our AI research team

Pricing

Is there a free tier for Grafana Cloud?

Yes, Grafana Cloud has a Free Forever plan available at no cost.

Security

What compliance certifications does Grafana Cloud have?

Grafana Cloud holds FedRAMP, NATSEC100, PCI DSS, A-LIGN, AICPA SOC Type II, and GDPR certifications.

Integration

Can Grafana connect to my existing data sources?

Yes, Grafana connects to existing tools and data sources—including Prometheus, Loki, Tempo, and dozens of third-party systems—with hundreds of plugins and integrations, requiring no rip-and-replace.

Features

How much can Grafana Cloud reduce telemetry costs?

Grafana Cloud's Adaptive Telemetry suite can cut telemetry costs by up to 80% by automatically identifying valuable data and aggregating the rest.

Setup

Can I try Grafana Cloud without creating an account?

Yes, Grafana Play lets you try Grafana Cloud instantly with no registration required.

Product Information

Platforms

weblinuxmacwindows

About Full-stack observability for the agentic era | Grafana Labs

Grafana Labs is a New York-based observability platform company that develops open-source and commercial tools for monitoring metrics, logs, traces, and application performance data.

Resources

Documentation
Blog
Changelog

Also in AI DevOps