An AI on-call agent that probes live production code to find root causes
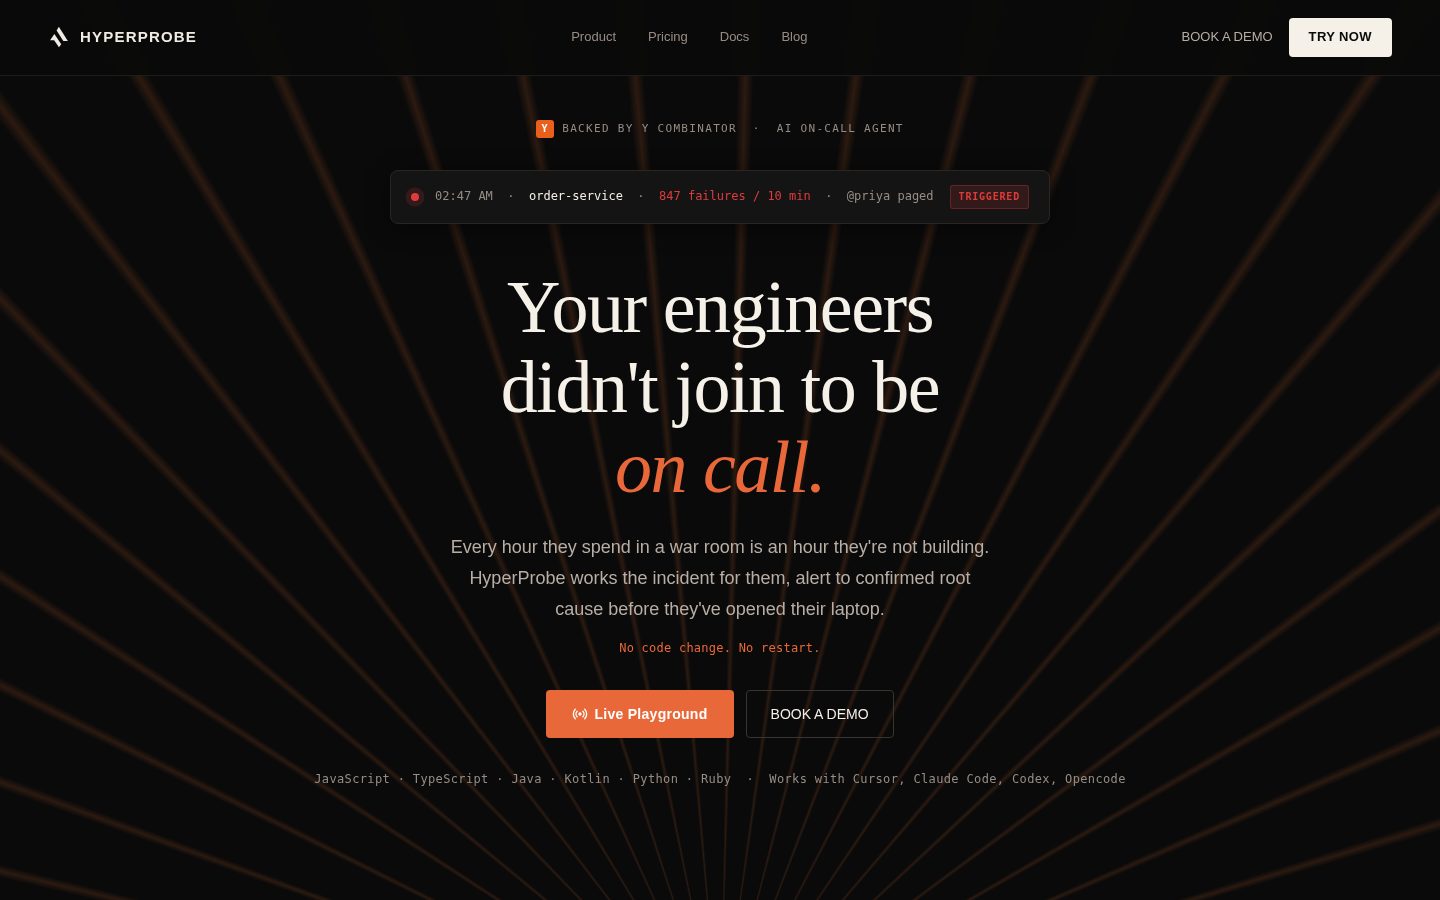
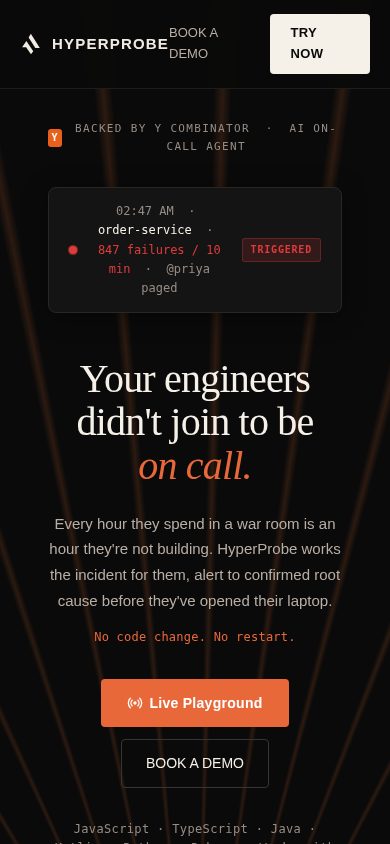
HyperProbe is an AI on-call agent that investigates production incidents for engineering teams.
AI Panel Score
6 AI reviews
Reviewed
Facts checked against hyperprobe.co
HyperProbe works as an automated responder to production incidents. When an alert fires from PagerDuty, Datadog, or Slack, it reads logs and traces to locate the file and line associated with the failure, then plans a debugging flow. If the existing logs don't contain enough information, it places a read-only, non-blocking probe on the suspect line in the live service. The probe fires on real traffic, captures the exact variable state at that moment, and then disappears, after which HyperProbe verifies its diagnosis against that captured evidence and delivers a confirmed root cause analysis.
The probe mechanism is designed to be read-only and non-blocking: it cannot write memory or execute code, every probe is logged in an immutable audit trail, and placement can be approval-gated. HyperProbe can run self-hosted or in a private VPC so that data does not leave the user's environment, with PII redacted at the agent before capture. The company states breakpoints fire asynchronously with less than 1% overhead at 3,000 RPS, so requests complete without user-visible impact. It targets failure modes that don't typically trigger alerts on their own, such as silent failures that return a 200 with the wrong body, exceptions whose stack trace points far from the actual cause, swallowed exceptions, race conditions and duplicate processing, third-party contract drift, and business metric drops with no exception in the stack. The site also lists memory leak diagnosis, OOM root cause analysis, CPU spike isolation, and latency spike tracing as capabilities shipping that month. It works with JavaScript, TypeScript, Java, Kotlin, Python, and Ruby, and integrates with coding agents including Cursor, Claude Code, Codex, and Opencode.
HyperProbe is built for engineering teams handling production incidents, particularly those where senior engineers are repeatedly pulled into on-call debugging. Pricing is structured per service rather than per engineer or per seat, with unlimited probes and captures on every plan. The Free plan covers one service on managed cloud at no cost. The Professional plan is $99 per service per month ($79 per service per month billed annually, with a 3-service minimum), covering unlimited services, 30-day capture history, and a shared workspace with saved probes. An Enterprise plan is available with custom, contact-based pricing for self-hosted or private VPC deployment, role-based access control, approval gates, and custom PII redaction rules.

Reads logs and distributed traces to automatically locate the suspect file and line and plan a debugging flow.
Verifies the diagnosis against captured evidence and delivers a confirmed root cause and suggested fix instead of a guess.
Captures the exact variable state when the probe fires on real production traffic, then discards the probe after capture.
Supports JavaScript, TypeScript, Java, Kotlin, Python, and Ruby codebases.
Places a non-blocking, read-only breakpoint on a suspect line in the live running service without redeploying or restarting it.
Fires breakpoints asynchronously so requests complete at full speed with less than 1% overhead at 3,000 RPS and zero user impact.
Picks up incident pages automatically from tools like PagerDuty, Datadog, or Slack to trigger the investigation workflow.
Works with Cursor, Claude Code, Codex, and Opencode to locate probe placement and assist with fixes.
Logs every probe placement and capture in an immutable audit trail with approval gating until trust is established.
Redacts personally identifiable information at the agent before capture, with security teams defining what can be observed.
Provides role-based access control and approval gates for enterprise teams before probes touch production.
Runs inside the customer's own infrastructure, self-hosted or in a private VPC, so no data leaves the environment.
For installing the SDK and seeing a real capture the same afternoon; 1 service on managed cloud
For teams running real production traffic who want the whole stack instrumented, not one service ($99/service/month billed monthly, $79 billed annually, 3 service minimum)
Custom annual contract with volume pricing for teams whose security review has to sign off before anything touches production
A YC-backed agent that debugs live production without a redeploy, priced per service not per seat.
“HyperProbe places read-only probes on running code to capture variable state at failure time. The pitch is sharp and the pricing model is unusually sane, but the company is brand new.”
Founded in 2026, backed by Y Combinator's Summer 2026 batch. That's month-zero to month-six territory, not a company with a track record yet. The idea is good: read-only breakpoints on live traffic, under 1% overhead at 3,000 RPS by their own numbers, no redeploy. That's a real architectural bet, not a dashboard with AI bolted on top.
Pricing per service instead of per seat is the smart move here. $79/service/month annually, 3-service minimum, unlimited probes on every plan. That punishes sprawl, not headcount, which is the right incentive for an on-call tool.
The tradeoff: self-hosted and RBAC live only in Enterprise, which is contact-pricing, so security-sensitive teams pay to find out the real cost. Immutable audit trails and approval gates are there, which matters when you're letting an agent probe production.
Live variable capture without redeploy is a distinct architecture versus log-and-trace-only incident tools.
Read-only, non-blocking probes with immutable audit trail and approval gating address the obvious fear of an agent touching live code.
Free tier installs via a single agent prompt and claims investigation drops from 3-4 hours to under 10 minutes.
Targets senior engineers stuck on-call, a real cost center, not a cosmetic workflow save.
Docs and a built-out pricing page exist, but the company is a 2026 YC startup with no multi-year track record yet.
Engineering teams with multiple services and senior staff drowning in on-call rotations.
Skip it if you run a single service or need self-hosted deployment on a tight budget.
A read-only production debugger that could become the next irreversible dependency in your incident path.
“HyperProbe puts live breakpoints on production code without redeploying, which is a genuinely new tool in the on-call stack. The real question for a VP of Eng is what happens to your team's own debugging muscle once an agent does this for three years straight.”
The architecture bet here is sound: async firing, sub-1% overhead claimed at 3,000 RPS, read-only probes that discard after capture. That's the right design for something touching live services — I'd want the same guarantees before it near my prod fleet. Multi-language support across JavaScript, Java, Kotlin, Python and Ruby means it can sit across a polyglot org instead of one stack.
My concern is three years out: once senior engineers stop manually tracing swallowed exceptions and race conditions, does the team retain the instinct to do it unassisted during a true outage when the agent itself is implicated? The coding-agent integrations (Cursor, Claude Code, Codex, Opencode) suggest HyperProbe wants to sit inside the whole remediation loop, not just diagnosis — that's a bigger surface commitment than a point tool.
Pricing per service, not per seat, rewards a focused service count and punishes sprawl — teams running fifty microservices need to model that before committing to the 3-service Professional floor at $79/service/month annually.
Sits ahead of alert-triage bots by acting directly on running code, a different tier of category than passive log aggregators.
Targets the exact failure modes — 200s with wrong bodies, swallowed exceptions, contract drift — that pull senior engineers out of sleep, per its own incident framing.
Ingests from PagerDuty, Datadog, and Slack and hooks into Cursor, Claude Code, Codex, and Opencode, a wide enough surface to matter day one.
Three years of agent-led root-causing raises a real question about atrophy of manual debugging skill on the team, a tradeoff the vendor doesn't address.
Live variable capture via read-only breakpoints without redeploy is a materially harder capability than log-correlation tooling most incident bots offer.
Engineering orgs with a handful of high-traffic services where senior engineers are repeatedly paged for ambiguous production failures.
Avoid if your team runs dozens of small services and wants debugging skill to stay sharp in-house rather than delegated to an agent.
Per-service pricing math: it's cheap thin, expensive wide. Know your service count first.
“$79/service/month annually, 3-service minimum, floors Professional at $237/month before you add one engineer. Billing model is unusually honest for what it is — just do the multiplication first.”
Per-service, not per-seat. Unusual billing model for DevOps tooling. 3-service minimum × $79 × 12 = $2,844/year minimum commitment, even for a 2-service shop. Monthly billing is $99/service — a 25% premium for skipping the annual lock. That's a real number, not a teaser rate.
Free tier covers 1 service, $0, managed cloud only. Good for proving the capture works before signing anything. But the jump from Free to Professional isn't incremental — it's 1 service to a 3-service floor overnight. No visible mid-tier for a 2-service team.
Enterprise is contact-sales, custom annual contract, volume pricing — standard for RBAC and self-hosted deployment, no complaint there. ROI framing (3-4 hours to under 10 minutes per incident) is the kind of number finance can actually model against engineer hourly cost. Auto-renewal terms on the annual contract aren't stated anywhere I could find.
Free plan removes procurement friction for a pilot, but moving to paid immediately triggers the 3-service minimum rather than a single-service upgrade path.
Annual billing requires a 3-service minimum commitment and I found no auto-renewal or cancellation terms stated on the pricing page.
Two tiers priced in public with exact monthly and annual numbers; only Enterprise is quote-based, which is normal for self-hosted.
The 3-4 hours to under 10 minutes incident time claim gives finance a concrete number to weigh against the $79/service cost.
Per-service billing means a 10-service fleet runs $790-990/month before Enterprise add-ons, not the seat-based math most DevOps budgets assume.
Teams running three or more services who can commit annually and want predictable per-service billing.
Avoid if you run one or two services and want to scale into paid gradually without a multi-service commitment.
A probe that promises zero overhead at 3,000 RPS — I want to see that graph at 3am during a real surge
“HyperProbe's read-only breakpoint model is the right answer to the 'add a log line, redeploy, wait' loop that eats every incident. The open question is how it behaves as a paged responder once it's woven into your actual rotation, not a staging demo.”
The async firing claim — sub-1% overhead at 3,000 RPS — is the number I'd want reproduced against my own traffic shape before trusting it in a page-escalation path, not a vendor benchmark. That's the whole pitch though: a probe that behaves like an APM sample, not a debugger that stops the world. If it holds under real load, that's a genuine category shift for mid-incident instrumentation. Ingesting from PagerDuty and Datadog directly into the investigation loop means one less tool to tab into during MTTR, which matters more than any dashboard. Approval-gating on probe placement is the detail I care about most — I don't want an agent setting breakpoints on payment-service code paths without a human sign-off step, and it sounds like that's configurable. Six-language coverage is solid for a polyglot fleet, but I'd want to know how it handles JVM thread dumps versus Python's GIL before trusting it on a CPU spike at 2am.
The core loop — alert to probe to confirmed root cause — sounds low-friction, but there's no incident-history track record yet to confirm it holds under real paging load.
I found docs and a blog, but couldn't confirm an API reference, which matters if I want to script probe approval into my own tooling.
Approval gating adds a review step before probes touch prod, which is the right tradeoff for safety but means on-call speed is bounded by whoever has to click approve.
Saved probes and a shared workspace on the Professional tier suggest a path from ad-hoc debugging to a team-level playbook, though custom redaction rules are gated to Enterprise.
Pulling alerts directly from PagerDuty, Datadog, and Slack means it sits inside the existing rotation rather than requiring a new dashboard to babysit.
Teams who get paged for silent failures and swallowed exceptions that never trip a proper alert on their own.
You need a multi-year incident track record on false-positive rates before trusting an agent with production breakpoints.
A tool that promises to never wake you up for nothing, if you trust it with a probe in prod
“HyperProbe reads logs, drops a read-only breakpoint on live traffic, and hands you a confirmed root cause instead of a guess. The real test isn't the demo, it's whether your team still trusts the page three months from now.”
Ten minutes in, this is the install-from-a-prompt pitch, SDK goes in, you get a real capture that same afternoon on the free tier. That's a good first hour. No fighting a config file, no reading a wiki page before you see value. For a tool whose whole job is showing up during someone's worst Tuesday, that matters more than most onboarding flows get credit for.
Where I get curious is month three. The thing lives inside PagerDuty and Datadog alerts, which means its daily feel depends entirely on how it behaves when it's wrong, not when it's right. I couldn't find anything showing what the UI does when a probe fires and the diagnosis is a near-miss, whether it says "I'm not sure" or just confidently hands you the wrong line. An immutable audit trail is reassuring for security review, less so for a tired engineer at 2am trying to tell confidence from guesswork at a glance.
Six languages, async firing under 1% overhead at 3,000 RPS, that's solid engineering. Whether the interface itself ages well is the open question I can't answer from here.
The free tier's same-afternoon capture suggests real attention to first impressions, but I found no detail on how diagnosis confidence is surfaced day to day.
Plugging into Cursor, Claude Code, Codex, and Opencode keeps it inside workflows engineers already know rather than teaching a new one.
I couldn't find any mention of a mobile app or responsive on-call interface, which matters for a tool meant to catch you off your laptop.
Install from a single agent prompt and a real capture the same afternoon on the free plan is a genuinely low-friction start.
Async breakpoints at under 1% overhead at 3,000 RPS and an immutable audit trail read as engineered for trust, though real-world drift is untested.
Engineering teams who page often enough that a confirmed root cause in minutes beats hours of log spelunking.
You need to see how the tool handles its own wrong answers before trusting it near production.
A debugger that touches live production traffic. That's a trust ask, not a feature.
“The read-only probe pitch is specific and the pricing page is clean. But a Y Combinator Summer 2026 company asking to instrument your running services is a big ask with zero operating history behind it.”
Founded in 2026. Backed by Y Combinator's Summer 2026 batch. That's the entire track record. The '<10 minutes' incident resolution number is concrete, which I like — vague claims worry me more than specific ones. But a specific claim from a company this young is a hypothesis, not a result.
The probe mechanism is the real pitch: read-only, non-blocking, async, under 1% overhead at 3,000 RPS. Specific enough to be checkable, which is a good sign. Still asking engineering teams to let an agent place breakpoints on running services it's never run in anger.
Pricing is honest: $99/service monthly, $79 annually, 3-service minimum. No seat games. I couldn't find an API reference, which matters if you want to automate approval gates rather than click through them by hand. For agents touching live traffic, I'd want that scriptable, not just safe.
Live variable capture without redeploy is a real mechanism, not just a repositioned log aggregator or APM dashboard.
Probes disappear after capture and the self-hosted VPC option avoids lock-in, but no stated data export or migration path.
YC backing signals runway but the company is months old with no multi-year changelog I could find to judge maintenance cadence.
The H1 is restrained for the category, and the overhead and RPS numbers are specific enough to be falsifiable.
A 2026-founded company with zero named customers or incident case studies backing the 'confirmed root cause' claim.
Teams with enough production incident volume to justify betting on a 2026-founded vendor's unproven root-cause claims.
You need a multi-year track record before letting anything place breakpoints on live services.
Common questions answered by our AI research team
HyperProbe traces logs and distributed traces to locate the suspect file and line, then places a read-only virtual breakpoint on that line in the running service. When the breakpoint fires on live traffic, it captures the exact variable state and delivers a confirmed root cause, cutting investigation time from 3-4 hours to under 10 minutes.
No. HyperProbe captures evidence from a live, running service without redeployment or restarting it, bringing redeployments per incident from 3-4 down to 0.
Professional tier costs $99 per service per month, or $79 per service per month billed annually with a 3 service minimum. The Free plan covers 1 service at $0 forever, and Enterprise uses custom annual contract volume pricing.
HyperProbe picks up alerts from tools like PagerDuty, Datadog, or Slack to automatically work the incident.
Yes. The Free and Professional tiers include default PII redaction, while Enterprise offers custom PII redaction rules per field and per file.
Company
HyperProbeFounded
2026Pricing
From $79/moFree Plan
AvailableHyperProbe is a San Francisco-based startup building an AI on-call agent that captures production code state at failure time without redeployment.