Engineering intelligence from IDE-level data, not status reports
PanDev Metrics is an AI engineering intelligence platform for measuring software delivery and developer productivity.
AI Panel Score
6 AI reviews
Reviewed
PanDev Metrics works by installing lightweight plugins inside a developer's IDE (VS Code, JetBrains, Cursor, Visual Studio) that capture event-level data as engineers work. This data is aggregated into dashboards and made queryable through conversational AI, giving engineering managers, CTOs, and individual developers metrics such as DORA (Deployment Frequency, Lead Time, Change Failure Rate, MTTR), SPACE framework indicators, DevEx scores, time-on-coding, and IDE usage patterns, rather than relying on self-reported status updates.
The platform connects to source control and project management systems including GitHub, GitLab, Bitbucket, Azure DevOps, Jira, ClickUp, Notion, and YouTrack. A separate component, PanDev CLI, is a free local command-line tool (`npx pandev`, requiring Node 20+, running on macOS, Linux, and Windows) that analyzes AI coding agent spend for individual developers: it breaks down monthly AI bills by task, branch, model, and file, attributing cost to the git branch active at the time of work (roughly 90% attribution accuracy) using git reflog. It reports per-prompt costs, active versus wall-clock time, model splits, and can generate a self-contained offline HTML dashboard via `pandev web`. The CLI is built with a no-account, no-network, no-telemetry design that can be verified with tools like tcpdump, and it prints a sha256 checksum via `pandev privacy` for comparison against published reproducible-build hashes. It works with Claude Code, Codex CLI, OpenCode, and ZCode logs.

Lets users ask an AI assistant conversational questions about engineering data instead of manually building dashboard views.
A free, local-only command-line tool that breaks down AI coding agent costs by task, branch, model, and file using git reflog attribution.
Analyzes collected IDE and integration data to produce DORA metrics such as deployment frequency, lead time, change failure rate, and MTTR.
Produces developer experience indicators to gauge engineering satisfaction and friction alongside productivity metrics.
The `pandev web` command builds a self-contained offline HTML dashboard visualizing AI agent cost and usage data.
Generates SPACE framework scores for individuals, teams, and organizations from aggregated development activity data.
Tracks time spent coding, debugging, and in meetings, along with detailed IDE usage statistics at individual, team, and org levels.
Lightweight plugins for 13 IDEs — VS Code (and forks such as Cursor and Windsurf), the JetBrains family, Visual Studio, Android Studio, Xcode and Eclipse — plus browser extensions, collect development data at the IDE event level.
Parses Claude Code, Codex CLI, OpenCode, and ZCode logs to compute per-task AI spend.
Connects to GitHub, GitLab, Bitbucket, Azure DevOps and Yandex Tracker for delivery data, and imports tasks from Jira, ClickUp, Notion, and YouTrack.
The CLI runs with no account, no network calls, and no telemetry, and `pandev privacy` prints a sha256 checksum to verify against published reproducible-build hashes.
Deploys fully on-premises via Docker or Kubernetes so all data stays inside the customer's own network, for regulated industries like fintech and govtech.
Free, local-only tool for individual developers to analyze AI coding agent spend by task, branch, and model
Full AI Engineering Intelligence Platform for engineering teams and organizations, available as SaaS or on-premises deployment; pricing not publicly listed and requires contacting sales or booking a demo
Thirty-eight public releases answer the vendor question; the Teams price is the only thing still hidden.
“PanDev Metrics pulls DORA and SPACE numbers off IDE plugins instead of status reports, and its public release log runs to 38 versions on a monthly cadence. The Teams/Enterprise tier still carries no price, so budgeting starts with a sales call.”
PanDev publishes its release log — 38 versions since January 2025, the current one 2.10.0 dated 11 August. That's an auditable monthly cadence, and it answers the vendor question I'd otherwise have to ask on the call.
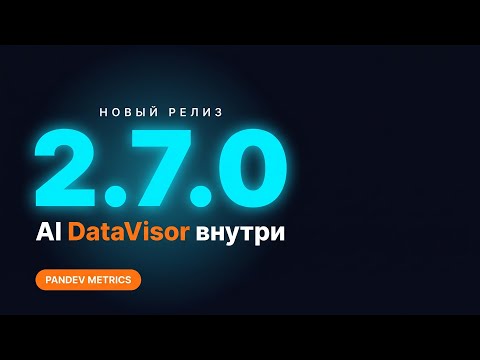
Version 2.8.0 shipped MCP and API keys in June, so the DORA and SPACE numbers come back out of the platform rather than living in someone else's dashboard. Thirteen IDE plugins, on-prem via Docker or Kubernetes, and the free PanDev CLI for AI spend — the surface is wider than the marketing suggests.
The catch is procurement: Teams/Enterprise shows no price at all, and every path there is Contact sales, so I can't size the line item before someone books a demo. IDE-level telemetry on named developers is also a conversation you have with the team before rollout, not after. Pilot one squad, get the number in writing.
IDE-event capture across 13 plugins plus reflog-based AI cost attribution near 90% accuracy is a distinct approach.
On-prem deployment and API key access limit lock-in, but individual-level IDE tracking still needs a trust conversation first.
Free CLI gives instant AI-spend visibility and API keys ease data extraction, but contact-only pricing delays the platform decision.
Replaces self-reported status data with IDE-level DORA/SPACE metrics, a real capability shift not just cost-saving.
Release log reaches 38 versions with 2.10.0 dated 11 August 2026, and the docs cover API keys — shipping is visible, pricing maturity is not.
Engineering leaders who want delivery metrics captured at the IDE level.
Buyers who need a published price before they will book a demo.
IDE-level telemetry plus on-prem deployment makes this a real DORA/SPACE play, not a status-report tracker.
“PanDev pulls DORA, SPACE, and DevEx signal straight from IDE plugins and git activity instead of self-reported check-ins. On-prem via Docker/Kubernetes is the part that gets it past security review.”
Event-level capture from VS Code, JetBrains, Cursor, and Visual Studio plugins is the right architecture for engineering intelligence — self-reported status updates are the thing every DORA rollout dies on, and IDE-level telemetry sidesteps that. Pairing it with GitHub, GitLab, Bitbucket, Azure DevOps, Jira, ClickUp, Notion, and YouTrack integrations means the metrics layer isn't guessing at delivery data from a single source.
The on-prem option via Docker or Kubernetes is the line item that matters for fintech and govtech. If I'm running a regulated shop, I don't ship IDE keystroke-adjacent data to a third-party SaaS without that escape hatch. Pricing for the team platform is contact-sales-only, though, which is friction I have to plan around before I can even scope a pilot.
The free PanDev CLI — no account, no network calls, sha256-verifiable — is a smart trust-building wedge, but it's a separate tool solving a narrower problem: AI agent spend, not org-wide delivery metrics. Adopt this and in three years you've got IDE-level observability baked into how you manage engineers, for better or worse with developer trust.
Sits ahead of status-report-based tools by capturing IDE telemetry directly, though contact-only pricing obscures where it lands cost-wise.
Matches how engineering leaders actually want to measure delivery: individual, team, and org-level views tied to real work, not standups.
Eight integrations (GitHub, GitLab, Bitbucket, Azure DevOps, Jira, ClickUp, Notion, YouTrack) cover the stack most engineering orgs already run.
On-prem via Docker/Kubernetes avoids vendor data lock-in, but IDE-level monitoring creates a cultural precedent that's hard to walk back.
DORA plus SPACE plus DevEx from IDE-event data is deeper than dashboard-only competitors relying on git metadata alone.
Engineering leaders who need DORA and SPACE metrics from actual IDE activity and may require on-prem deployment for compliance.
Avoid if you need transparent self-serve pricing or your team will resist IDE-level activity monitoring.
The $0 CLI itemizes your AI coding spend; the team platform carries no number at all.
“PanDev CLI is free, local, and turns AI agent spend into a per-branch line item. The Teams platform that carries DORA, SPACE and the IDE plugins publishes no price at all.”
The AI coding bill is the newest line item nobody can itemize. PanDev CLI does it for $0 — cost by task, branch, model and file, attributed to the active git branch at roughly 90%. No account, no telemetry — `pandev privacy` prints a verifiable checksum.
The Teams / Enterprise tier is where DORA, SPACE and the IDE plugins live. It shows Contact sales and nothing else — honest, but not a number. No seat rate, no on-prem premium, no pricing page. Fifty developers could land at $15K or $150K. You find out on the call.
The release log is public and busy — 2.10.0 shipped 2026-08-11, MCP and API keys in 2.8.0, so the data exports. The catch is on-prem: Docker or Kubernetes buys infrastructure and engineer hours the SaaS tier absorbs, unpriced. Free at one desk, unquoted at fifty.
Every team purchase routes through a sales call or demo, while the CLI needs no account at all.
Term length, renewal windows and cancellation terms are not published anywhere, so this stays neutral.
The CLI is publicly $0, but the Teams tier shows only Contact sales and the site has no pricing page.
Per-branch AI cost attribution at roughly 90% plus DORA and SPACE give measurable before-and-after numbers.
On-prem via Docker or Kubernetes adds infrastructure and maintenance the vendor never quantifies.
Individual developers who want their AI agent spend itemized for free.
Buyers who need a budget number before they will take a sales call.
DORA off IDE telemetry instead of self-reported tickets — that's the real pitch, not the AI chat bolt-on.
“IDE-level plugins across VS Code, JetBrains, Cursor, and Visual Studio give this a legit shot at DORA/SPACE without the survey-fatigue problem. The CLI's local-only spend attribution is the more interesting artifact — verifiable, no-telemetry, sha256-checked.”
Paging at 3am, I care about MTTR and change failure rate being accurate, not vibes-based. PanDev pulls those from IDE events plus Git/Jira/ClickUp rather than asking engineers to self-report, which is the right instinct — self-reported status data rots fast under incident pressure. On-prem via Docker or Kubernetes matters too; fintech/govtech shops that can't ship IDE telemetry off-network get a real option, not a promise.
Day-3 concern: IDE plugins across thirteen editors is real surface area to keep patched and low-overhead. Rolling out Cursor/JetBrains/VS Code agents without perf complaints from devs is nontrivial, and I couldn't find any telemetry footprint numbers.
The CLI is the sleeper feature: no account, no network calls, tcpdump-verifiable, reflog-based cost attribution at ~90% accuracy. That's the kind of tool an SRE trusts on-call. Tradeoff: pricing is 'contact sales' for the actual platform, so I can't size cost against DORA-tooling alternatives yet.
IDE-level capture avoids status-report rot but plugin overhead across thirteen IDEs is unproven.
Docs exist and CLI ships reproducible-build checksums verifiable via tcpdump, a detail written by people who'd actually check, plus a public release log and an API-keys page.
One plugin per IDE plus multiple tracker integrations is several moving parts to babysit weekly.
Per-prompt cost, active-vs-wall-clock time, and branch/model/file attribution in the free CLI show real depth beyond dashboard summaries.
Git/Jira/ClickUp/Azure DevOps integrations plus on-prem Docker/Kubernetes deployment fit existing SRE/platform stacks without forcing new habits.
Platform/SRE teams that need DORA and DevEx metrics grounded in real IDE activity rather than sprint self-reports.
You need transparent self-serve pricing today or your team is standardized on an AI coding tool outside Claude Code, Codex CLI, OpenCode, and ZCode.
The free CLI and the paid platform measure two different things — don't mistake one for a trial
“PanDev CLI is free and answers what your AI coding agents cost. The Teams platform answers how your team delivers, and the free tool is not a preview of it.”
Two different products share this name. PanDev CLI is the free one: local, no account, reads Claude Code, Codex CLI, OpenCode and ZCode logs, and breaks last month's AI agent spend down by branch and file. Run `pandev privacy` and it prints a sha256 you can check against their published build. Rare.
The Teams platform is the other product: 13 IDE plugins feeding DORA and SPACE scores off real editor events, not off whatever people said in standup. It has a real release log, too — 38 versions, 2.10.0 dated 2026-08-11, MCP and API keys since 2.8.0. You can see the pace.
But the free tool isn't a trial of the paid one. They measure different things, and the Teams tier has no listed price — book a demo, wait for a callback. For a product this checkable everywhere else, that's the one closed door.
The CLI's details are thought through, down to a local dashboard at 127.0.0.1:4976, and the 2.10.0 notes cover unglamorous work like safer integration disconnects.
Conversational AI Queries plus the Knowledge Base docs added in 2.10.0 mean you can ask for a DORA number instead of building the view.
This lives in the IDE and the browser, and nothing is published about a phone app or a mobile dashboard either way.
The CLI is one npx command on Node 20+, but the Teams platform starts with a demo request instead of a signup.
Thirty-eight releases since January 2025 and a current 2.10.0 dated 2026-08-11 show steady maintenance, though no uptime or incident history is published.
Engineering managers who want delivery metrics measured from real IDE activity.
Teams who need a self-serve price before they will book a sales call.
Thirty-eight releases and a verifiable checksum; the DORA dashboards are the part still unproven.
“The release log and the CLI both check out — 38 versions deep, current as of August 2026, with a privacy claim you can verify yourself. What's missing is a published price for the platform tier and any worked example behind the DORA and SPACE scores.”
Checked the release log first. Thirty-eight entries, 2.10.0 dated 11 August 2026. MCP and API keys landed in 2.8.0 in June, with a docs page behind them. They ship.
The CLI holds up on its own. `npx pandev` runs with no account and no network calls, and `pandev privacy` prints a sha256 checksum to match against published reproducible-build hashes. Local Privacy Verification is a claim you can actually falsify.
The dashboards are where I'd slow down. DORA, SPACE and DevEx scores off 13 IDE plugins — broad surface, but no published case data showing those numbers moved anyone's delivery. And Teams / Enterprise carries no price, just Contact sales. On-prem via Docker or Kubernetes is the real hedge. Self-host from day one and the data stays yours whatever happens to the vendor.
IDE-level capture across 13 plugins instead of status reports is a real angle, though DORA and SPACE dashboards are a crowded shelf and the free CLI is the more distinctive half.
On-premises Docker or Kubernetes deployment plus API keys means both the install and the data can stay on your side of the wall.
Thirty-eight releases with 2.10.0 dated August 2026, versioned docs and API keys — the maintenance cadence is real, but the paid tier's public surface stays thin.
CLI claims are independently verifiable and the dated release log backs the shipping claims; the DORA and SPACE scores still carry no published case data.
Named capabilities are specific and checkable — git reflog attribution at roughly 90% accuracy, MCP and API keys in 2.8.0 — but the productivity-score claims have no worked example behind them.
Engineering orgs in regulated industries that need DORA metrics running inside their own network.
Buyers who need a published platform price before starting an evaluation.
Common questions answered by our AI research team
PanDev Metrics supports IDE plugins for VS Code, JetBrains, Cursor, and Visual Studio, capturing time-on-coding and IDE usage statistics directly from these environments.
Yes. PanDev Metrics is available as SaaS or fully on-premises via Docker or Kubernetes, letting organizations keep data inside their own network.
PanDev Metrics imports tasks from Jira, ClickUp, Notion, and YouTrack for project management data.
Yes. PanDev Metrics analyzes development data to produce DORA metrics, along with SPACE framework scores and DevEx indicators at individual, team, and organization levels.
PanDev Metrics integrates with GitHub, GitLab, Bitbucket, and Azure DevOps for git hosting.
Company
PanDev MetricsPricing
Contact for pricingFree Plan
Available


PanDev Metrics provides an engineering intelligence platform that collects real-time development data from IDEs, Git providers, and task trackers.