Dynatrace logo

Dynatrace Review

Visit

Observability and security for cloud, applications, and infrastructure

Dynatrace is an AI-powered observability platform for monitoring applications, infrastructure, and cloud environments.

Dynatrace·Founded 2005·Usage-basedFree TrialAI AnalyticsAI DevOpsAI Security

AI Panel Score

7.6/10

6 AI reviews

Reviewed

AI Editor Approved

About Dynatrace

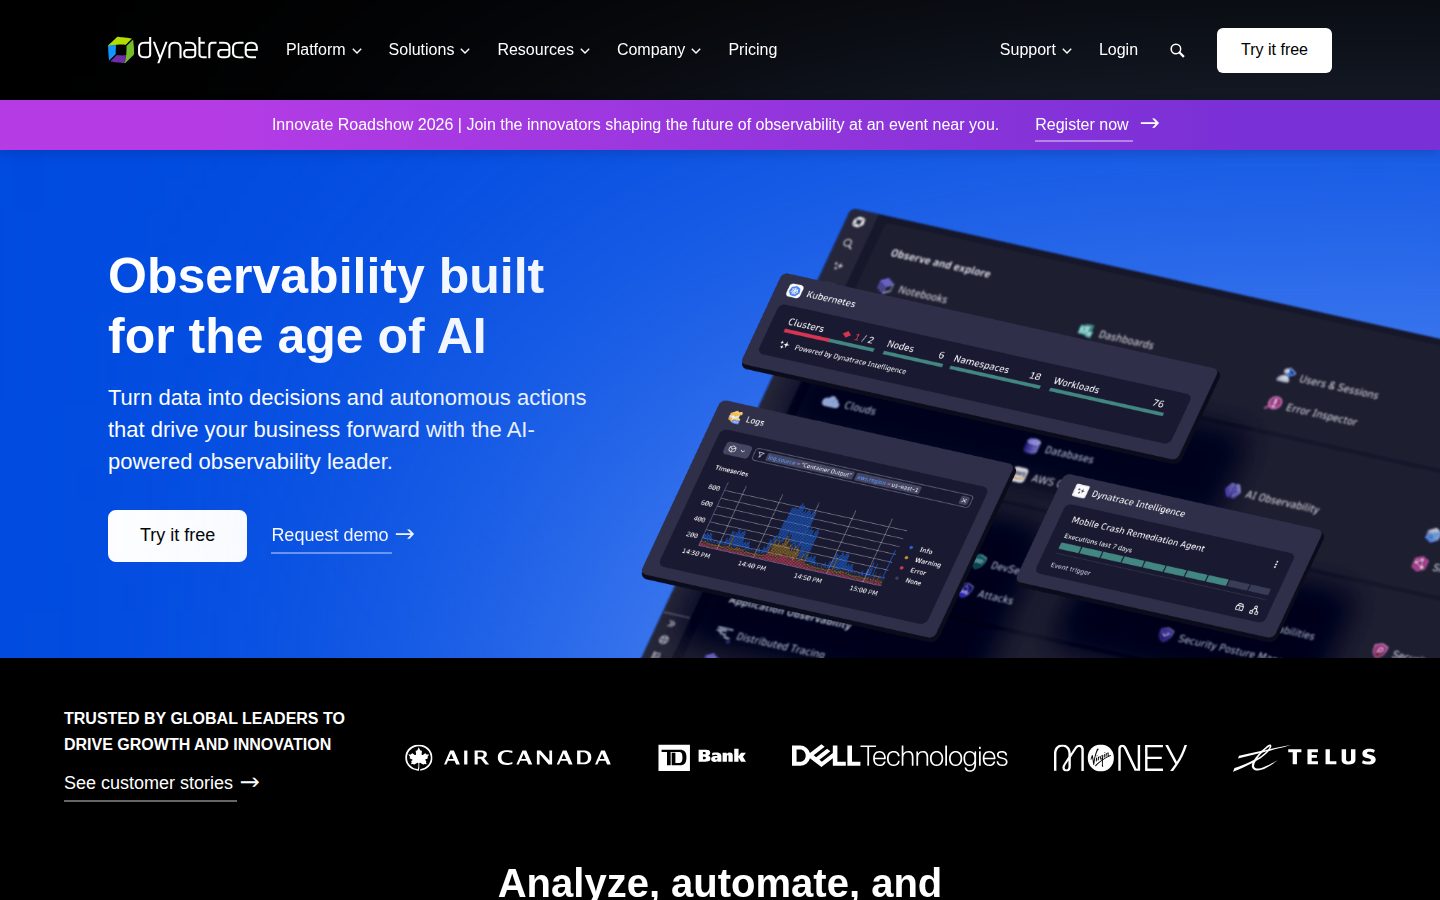
Dynatrace deploys through OneAgent, an automated instrumentation agent that discovers and monitors applications, services, hosts, containers, and cloud infrastructure without manual configuration. Once deployed, it maps this environment in real time through Smartscape, a topology model that shows dependencies across the full stack. Teams use the platform to build dashboards and notebooks, set up alerting, and query unified telemetry, log, and business data stored in Grail, Dynatrace's proprietary data lakehouse that keeps data in its original context rather than flattening it into separate silos.

The platform's distinguishing technical components include PurePath, a distributed tracing technology for code-level transaction analysis, and Davis AI, which performs causal (rather than purely statistical or correlative) analysis of telemetry data to identify root causes of incidents automatically. OpenPipeline handles ingestion and processing of data from any source, including OpenTelemetry, at scale. AutomationEngine and AppEngine let customers build custom workflows and applications on top of the platform, and Dynatrace Hub provides prebuilt extensions and integrations with major cloud providers (AWS, Azure, Google Cloud), Kubernetes, SAP, ServiceNow, and Red Hat, among others. A newer MCP (Model Context Protocol) server lets AI coding assistants like GitHub Copilot query observability data directly.

Dynatrace is aimed at enterprise IT operations, platform engineering, SRE, DevOps, and application security teams managing large-scale, distributed, or hybrid cloud environments. It competes with platforms such as Datadog, New Relic, Splunk, and AppDynamics in the observability and AIOps category, and is recognized in analyst reports including the Gartner Magic Quadrant for Observability Platforms and the Forrester Wave for AIOps.

The platform is delivered as SaaS (with a Managed/self-hosted deployment option also available) and covers infrastructure monitoring, application security, log management, digital experience monitoring, and business observability within one licensed product rather than as separate tools.

Features

AI

  • Davis AI / Dynatrace Intelligence

    Delivers precise causal answers, intelligent automation, and AI-driven recommendations by analyzing telemetry across the platform.

Analytics

  • Dashboards and Notebooks

    Offers customizable dashboards and interactive notebooks for visualizing and querying observability and business data.

  • Grail

    A data lakehouse that stores, unifies, and contextually analyzes observability, security, and business data at scale without rehydration.

  • PurePath

    Captures distributed traces and code-level analysis to pinpoint performance issues down to individual code paths.

Automation

  • AutomationEngine

    Enables extensible, answer-driven automation workflows that respond to insights generated across the platform.

  • Workflows

    Lets teams build automated processes triggered by platform events, alerts, or scheduled conditions.

Core

  • OneAgent

    Provides continuous, automatic discovery and full-stack observability across infrastructure, applications, and services with a single agent deployment.

  • Smartscape

    Automatically maps application and infrastructure topology in real time to provide contextual dependency visualization.

Customization

  • AppEngine

    Allows users to build custom, compliant, data-driven applications on top of Dynatrace data and services.

Integration

  • Dynatrace Hub

    A marketplace of supported technologies, integrations, and extensions from Dynatrace and partners for extending platform functionality.

  • MCP Server

    Exposes Dynatrace data and capabilities via Model Context Protocol for integration with AI copilots and developer tools like GitHub Copilot.

  • OpenPipeline

    Ingests, processes, enriches, contextualizes, and persists data from any source at scale into the platform.

Security

  • Application Security

    Provides runtime vulnerability analytics and security posture management to detect and prioritize threats in running applications.

Preview

Dynatrace desktop previewDynatrace mobile preview

Pricing Plans

Contact Sales

Contact sales

Dynatrace uses a usage-based pricing model with rates that vary by module (infrastructure, application observability, logs, security, etc.). The scraped content is the site navigation and does not list specific consumption prices; a free trial is available and detailed pricing requires visiting the dedicated pricing page or contacting sales.

  • Full-stack observability platform (Grail, Smartscape, OneAgent, PurePath)
  • AI-powered insights and automation (Davis AI, AutomationEngine)
  • Usage-based consumption pricing across modules
  • Free trial available
  • Custom quotes based on usage and modules selected

AI Panel Reviews

The Decision Maker

The Decision Maker

Strategic bet, vendor viability, timing, adoption approval
8.1/10

Publicly traded, deeply embedded, priced by the drink — this is a board-safe bet with a real invoice risk.

Dynatrace is a category leader with genuine breadth: Grail, Davis AI, PurePath, all built for enterprise scale. The catch is usage-based pricing that grows with you whether you planned for it or not.

Publicly traded since 2019, decades in market, Gartner Magic Quadrant regular. Nobody on the board asks 'who's Dynatrace' — that question is settled. Vendor viability isn't the risk here.

The risk is the invoice. Full-Stack Monitoring runs $58/mo per 8 GiB host, Kubernetes Platform Monitoring adds $1.40/mo per pod, security posture management another $5/mo per host. Stack those across a real fleet and usage-based becomes usage-unpredictable — Datadog and New Relic have the same problem, but Dynatrace's causal AI (Davis) and Grail lakehouse are genuine technical differentiators, not just marketing.

This moves you forward if you're already drowning in siloed telemetry and need one throat to choke. It doesn't move you forward if you're a 40-person startup that just needs uptime alerts.

Competitive Positioning8.2

Competes head-on with Datadog and New Relic; MCP server for Copilot integration is a forward-looking edge.

Reputation Risk8.7

Named in Gartner MQ and Forrester Wave for AIOps — a safe, defensible pick to present upward.

Speed to Value7.0

OneAgent auto-instruments fast, but usage-based pricing across modules means cost clarity lags actual deployment.

Strategic Fit8.0

Consolidates APM, logs, security, and DEM into Grail — real platform consolidation, not just cost-cutting.

Vendor Viability9.3

Public company, long track record, no runway risk to worry about.

Pros

  • Davis AI does causal root-cause analysis, not just correlation
  • Grail unifies telemetry, logs, and business data without flattening context
  • MCP server plugs directly into AI coding assistants like GitHub Copilot

Cons

  • Per-host, per-pod, per-container pricing adds up fast at scale
  • No published flat pricing — every deal needs a sales call
  • Overkill for teams without genuinely large hybrid-cloud estates

Right for

Enterprise platform and SRE teams running large hybrid-cloud estates who need one root-cause answer, not five dashboards.

Avoid if

Skip it if you're a small team that just needs basic uptime and error alerting.

The Domain Strategist

The Domain Strategist

Craft and strategy in the product's domain — adapts identity per category, same lens
8.3/10

Grail's context-preserving lakehouse is the right long-term data architecture for observability at scale.

Dynatrace treats telemetry as a schema problem worth solving properly instead of flattening everything into time-series soup. That's rare, and it shows in the pricing granularity down to per-pod, per-container metering.

Grail is the headline here, not Davis AI. Keeping observability, security, and business data in original context instead of rehydrating into flat tables is a real data-architecture decision, and it's the piece that determines whether your causal analysis actually holds up three years from now versus degrading into correlation guesswork like most AIOps vendors ship.

Davis AI's causal claim is meaningfully differentiated from Datadog's Watchdog or New Relic's correlative anomaly detection, if the causal graph actually generalizes past demo-scale topologies. PurePath's code-level tracing plus OpenPipeline's any-source ingestion gives you a real pipeline story, not just an agent story.

The cost model is the constraint: $0.01/GiB-hour host pricing plus $1.40/pod for Kubernetes plus $5/host for security posture adds up fast at fleet scale, and switching off Grail once your dashboards, workflows, and AppEngine apps depend on its schema is a multi-quarter migration, not a config change.

Category Positioning8.6

Named in Gartner's Observability MQ and Forrester's AIOps Wave, competing directly with Datadog, New Relic, Splunk, and AppDynamics.

Domain Fit8.5

OneAgent auto-discovery and Smartscape topology mapping match how SRE and platform teams actually triage incidents in hybrid cloud.

Integration Surface8.4

Dynatrace Hub covers AWS, Azure, GCP, Kubernetes, SAP, ServiceNow, plus a new MCP server for Copilot-style AI coding assistants.

Long-term Implications7.6

Once workflows, AppEngine apps, and dashboards are built on Grail's schema, migrating off is a multi-quarter effort, not a swap.

Strategic Depth8.8

Grail's context-preserving lakehouse plus causal (not correlative) analysis via Davis AI is a deeper architectural bet than most competitors make.

Pros

  • Grail lakehouse preserves data context instead of flattening into silos
  • Davis AI performs causal root-cause analysis, not just correlation
  • Granular usage-based pricing (down to per-pod, per-container) suits variable workloads
  • MCP server integration puts observability data directly into AI coding assistant workflows

Cons

  • Usage-based pricing across many metered modules gets complex to forecast at fleet scale
  • Schema and workflow lock-in to Grail makes a future platform switch costly
  • No published base price; full cost picture requires a sales conversation

Right for

Enterprise platform engineering and SRE teams running distributed hybrid-cloud environments who need causal root-cause analysis, not just dashboards.

Avoid if

Avoid if your team is small, cost-sensitive, and doesn't need code-level tracing or compliance-grade security posture management.

The Finance Lead

The Finance Lead

Money, total cost of ownership, contracts, procurement math
6.4/10

$58/host, $5/host, $1.40/pod, $3.60/container — six meters, one invoice you can't forecast.

Dynatrace prices by the drip, not the seat. Finance teams will need six months of usage data before they trust the forecast.

Full-Stack Monitoring: $58/mo per 8 GiB host. Security Posture: $5/host. Kubernetes: $1.40/pod. Code Monitoring: $3.60/container. Four meters, four growth curves. Multiply by 200 hosts, 500 pods, and usage creep, and year-1 estimates rarely survive contact with year-3 invoices.

No published bundle price. No self-serve tier sheet — you get a pricing page and then a sales call. Compare to Datadog, which at least publishes per-host tiers publicly. Dynatrace's compliance coverage (CIS, NIST, DORA, HIPAA) is real and audit-grade, but you're pricing that value blind until procurement gets a quote.

Usage-based billing means no seat math, which is honest in one sense — you pay for what you instrument. But it also means the CFO can't model spend without a consumption history. Budget for overage. Budget for a sales cycle before you see a number at all.

Billing & Procurement5.0

Sales-quote model (capabilities show pricing-page=Y but no self-serve checkout) adds procurement lead time.

Contract Flexibility5.5

Enterprise usage contracts typically include annual commits; evidence doesn't show termination terms.

Pricing Transparency4.5

Per-unit rates for four modules are public, but no bundled total exists without contacting sales.

ROI Clarity7.0

Davis AI's causal root-cause claims are measurable via MTTR, but no case-study numbers given here.

Total Cost of Ownership5.8

Multi-meter billing (host, pod, container, GiB-hour) compounds fast at 200+ hosts over 3 years.

Pros

  • Granular usage pricing means you pay for actual instrumentation, not idle seats
  • Single platform covers APM, security, and Kubernetes — fewer vendor invoices to reconcile
  • Compliance coverage (HIPAA, DORA, NIST) priced separately at $5/host, easy to isolate cost

Cons

  • Four distinct pricing meters make 3-year forecasting a spreadsheet exercise, not a lookup
  • No bundled quote published — sales call required for real numbers
  • Usage-based model punishes scale unpredictably vs. Datadog's published per-host tiers

Right for

Enterprises with mature FinOps practices that can model multi-meter usage growth.

Avoid if

You need a fixed number for next year's budget without a sales call.

The Domain Practitioner

The Domain Practitioner

Daily hands-on reality in the product's domain — adapts identity per category, same lens
8.1/10

Deep causal AI and Grail context modeling, but the metering model itself is a daily cost query.

Davis AI's causal root-cause analysis and Smartscape topology mapping are genuinely differentiated versus correlation-based competitors. The tradeoff shows up in the billing model, not the telemetry.

OneAgent auto-instrumentation is the pitch every observability vendor makes, but Smartscape's real-time topology mapping plus Grail keeping data in original context (not flattened into silos) is a real architectural difference versus Datadog or New Relic's more siloed indices. Davis AI doing causal analysis instead of statistical correlation matters at 2am when you need one root cause, not a ranked list of maybes.

Day-3 reality: the per-GiB-hour metering ($0.01/GiB-hour, $1.40/pod for Kubernetes, $3.60/container for Code Monitoring) means practitioners spend real time cost-modeling ingestion before they query anything. That's a new habit, not a natural fit.

Docs capability shows API=N, blog=N, changelog=N on the scrape — a red flag for practitioners hunting query syntax at 11pm. Power-user depth is high (AppEngine, AutomationEngine, MCP server for Copilot), but discoverability of that depth versus Datadog's more self-serve UX is the open question.

Day-3 Reality7.8

PurePath and Davis AI deliver real code-level root cause, but usage-based billing per GiB-hour adds cognitive overhead beyond the demo.

Documentation Practitioner-Fit6.8

Scrape shows docs=N, API=N, changelog=N — no visible evidence of practitioner-grade reference material.

Friction Surface7.0

Five separately-metered modules (hosts, pods, containers, security) means procurement and cost-tracking friction compounds weekly.

Power-User Depth8.8

AppEngine, AutomationEngine, and OpenPipeline give genuine build-your-own-app depth beyond dashboards, matching Splunk's extensibility ambitions.

Workflow Integration8.0

MCP server integration with GitHub Copilot and VS Code/JetBrains support for Code Monitoring shows real developer-workflow thinking.

Pros

  • Davis AI performs causal, not just correlative, root cause analysis
  • Grail lakehouse preserves data context instead of flattening into silos
  • MCP server lets Copilot and AI assistants query observability data directly

Cons

  • Granular per-module usage pricing ($0.01/GiB-hour, $1.40/pod, $3.60/container) complicates cost forecasting
  • Scraped evidence shows no visible docs, API reference, or changelog
  • 10-day trace retention on Full-Stack Monitoring is thin for long-tail incident review

Right for

Enterprise SRE and platform engineering teams running large hybrid-cloud estates who need causal root cause over correlation.

Avoid if

Avoid if your team needs predictable flat-rate billing or lacks headcount to manage per-module usage costs.

The Power User

The Power User

Daily human experience, onboarding, polish, learning curve, reliability
7.6/10

Powerful enough to run your whole stack, priced in a way that'll keep you nervous doing math every month.

Dynatrace throws everything at the wall — infra, APM, security, logs, AI root-cause — and mostly it sticks. But the billing model means you'll never quite relax.

OneAgent auto-instruments everything, which is great on day one. No config hell, no manual tagging fifty services. That's the demo glow, and it's earned. Davis AI doing causal analysis instead of just correlation is the real differentiator versus Datadog or New Relic, who mostly hand you a pile of alerts and let you connect dots yourself.

But three months in you're staring at a bill built from a dozen meters: $58/mo per 8 GiB host, $1.40/mo per Kubernetes pod, $3.60/mo per container for Code Monitoring, $5/mo per host for security posture. Every module has its own tap running. That's not a pricing page, that's a spreadsheet job.

The platform itself — Grail, Smartscape, PurePath — is genuinely deep, and the new MCP server letting Copilot query your observability data is a smart bet on where this category's heading. Just don't expect the pricing anxiety to go away once the tool clicks.

Daily Polish7.8

Smartscape topology and PurePath tracing suggest real attention to workflow detail, per the feature set.

Learning Curve7.0

AutomationEngine, AppEngine, and OpenPipeline add real depth but also real surface area to learn over the first few months.

Mobile Parity5.0

Platform listed as web-only with no mobile app mentioned in evidence, category norm for enterprise observability tools.

Onboarding Experience7.0

OneAgent auto-discovery removes manual setup, but usage-based pricing with no listed starting price makes early evaluation homework.

Reliability Feel8.2

Grail lakehouse keeping data in original context and Davis AI causal analysis point to a mature, enterprise-grade backbone.

Pros

  • OneAgent gives automatic full-stack instrumentation with no manual config
  • Davis AI does causal root-cause analysis, not just correlation
  • MCP server integration with GitHub Copilot is a forward-looking move
  • Covers observability, security, and business data in one licensed platform

Cons

  • Usage-based pricing across a dozen separate meters makes cost forecasting hard
  • No published starting price, so real cost only shows up after talking to sales
  • No mobile experience mentioned anywhere in the evidence

Right for

Enterprise platform, SRE, and security teams running large distributed or hybrid cloud environments.

Avoid if

Avoid if you're a small team wanting predictable flat pricing like a single Datadog line item.

The Skeptic

The Skeptic

Contrarian. Watch-outs, deal-breakers, broken promises, category patterns
7.2/10

Enterprise observability that's real, priced by the GiB-hour, and hard to leave.

Dynatrace has the feature depth and analyst validation of a genuine category player. The exit cost is the part the pricing page won't tell you.

$58/mo per 8 GiB host, $0.01 per GiB-hour, $1.40 per pod for Kubernetes. That's granular metering, not a hand-wave. Davis AI's causal-analysis pitch and Grail's no-rehydration lakehouse are real differentiators against Datadog and New Relic's more bolt-on AI stories, and Gartner Magic Quadrant placement isn't nothing.

Worry is depth, not honesty. OneAgent, Smartscape, PurePath, Grail — once telemetry, dashboards, and workflows are wired into that proprietary lakehouse, migration is a rebuild, not a swap. Splunk and AppDynamics customers know this pattern; enterprise observability vendors count on switching costs as a retention strategy.

Marketing stays fairly grounded — 'observability built for the age of AI' is aspirational, but the feature list backs it up. Ten-day trace retention on the base tier is thin for a platform this large.

Competitive Differentiation7.5

Causal AI via Davis AI and unified Grail storage differ from Datadog's more siloed, correlation-heavy model.

Exit Portability5.0

Grail lakehouse and Smartscape topology data are proprietary; no stated export path away from the platform.

Long-term Viability8.0

Usage-based pricing across granular modules (per-pod, per-container, per-host) signals a mature, still-shipping commercial engine.

Marketing Honesty7.5

Headline leans on 'AI' hype but the underlying feature set (PurePath, OpenPipeline) is documented and specific, not vaporware.

Track Record Match8.0

Gartner MQ and Forrester Wave placement plus a decade-plus in APM matches category winners, not graveyard entrants.

Pros

  • Granular, transparent per-unit pricing across modules (pods, containers, hosts)
  • Davis AI does causal root-cause analysis, not just correlation
  • MCP server integration shows active adaptation to AI coding workflows
  • Recognized in Gartner MQ and Forrester Wave for observability/AIOps

Cons

  • Proprietary Grail lakehouse creates real migration friction
  • 10-day trace retention on base Full-Stack tier is short
  • Pricing complexity across modules makes total cost hard to estimate upfront
  • Crowded field against Datadog, New Relic, Splunk, AppDynamics

Right for

Enterprise platform engineering and SRE teams running large hybrid-cloud environments who need unified full-stack observability.

Avoid if

Avoid if you're a smaller team wary of proprietary data lock-in or need fast, cheap exit options in 18 months.

Buyer Questions

Common questions answered by our AI research team

Pricing

How much does Dynatrace Full-Stack Monitoring cost?

Full-Stack Monitoring costs $58/mo per 8 GiB host, billed at $0.01 per memory-GiB-hour. It includes APM, automated root cause analysis for end-to-end transactions, code-level profiling, Kubernetes Platform Monitoring, and OpenTelemetry metrics and traces with 10 days of trace retention.

Security

What compliance standards does Security Posture Management cover?

Security Posture Management covers compliance standards including CIS, NIST, DORA, HIPAA, and more, continuously identifying misconfigurations and creating evidence for auditing purposes. It's priced at $5/mo per host.

Features

Does Dynatrace support Kubernetes monitoring?

Yes. Kubernetes Platform Monitoring provides visibility into Kubernetes clusters, nodes, and workloads, including CPU, memory, network metrics, health views, and topology data, priced at $1.40/mo per pod.

Integration

Can Code Monitoring integrate with Visual Studio Code?

Yes. Code Monitoring offers live code troubleshooting and debugging with non-breaking breakpoints, and integrates with Visual Studio Code and JetBrains, priced at $3.60/mo per container.

Setup

How does OneAgent handle full-stack instrumentation?

OneAgent provides automatic full-stack instrumentation, deploying across infrastructure, applications, and services to collect telemetry data that feeds into Dynatrace's Grail data lakehouse and Davis AI for root cause analysis.

Also in AI Analytics